Service
Freelance dashboard designer and developer for admin panels and analytics
I design and build dashboards: admin panels, analytics dashboards and the main screens of SaaS products. I design them in Figma so the important numbers are easy to read, then build them with React and Next.js and connect them to your real data.
- Experience
- 5+ years
- Based in
- Surat, India (remote)
- Clients
- Worldwide, mainly USA and Europe
- Price
- Quoted per project
What I can do for you
Dashboard UI design
Layout, charts, tables, filters and empty states designed in Figma around the questions the user needs answered.
Admin panels
Screens for managing users, orders, content and settings, with search, filters and bulk actions.
Analytics dashboards
KPIs, trends and breakdowns with charts that are easy to read and correct.
Data and APIs
The queries and API endpoints behind the dashboard, built so pages stay fast as the data grows.
Real-time updates
Numbers and tables that refresh as things happen, where the product needs it.
Roles and access
Different views and permissions for admins, managers and team members.
Who this is for
- SaaS founders who need the main dashboard of their product designed and built
- Businesses that want one screen for the numbers they now collect from several tools
- Teams with an existing dashboard that is slow, cluttered or hard to read
Tools I use
How a project runs
Questions first
We list what each user needs to know and do when they open the dashboard.
Data check
Where each number comes from and whether it can be trusted.
Wireframe
A simple layout showing what goes where, for you to review.
Design
The full interface in Figma, including tables, charts, filters and mobile layouts.
Build
React or Next.js front end connected to your API or database.
Test and hand over
Numbers checked against the source, speed checked with real data volumes.
Related work
-
 Process guide
Building a new SaaS product: an MVP-first process
Six stages: discovery, planning, UI/UX design, development, testing, then launch and improvement.
Read the process guide → -
 Process guide
From zero to hero: SaaS idea to brand and product
My 8-step process, from discovery and naming to MVP, launch and brand guidelines.
Read the process guide → -
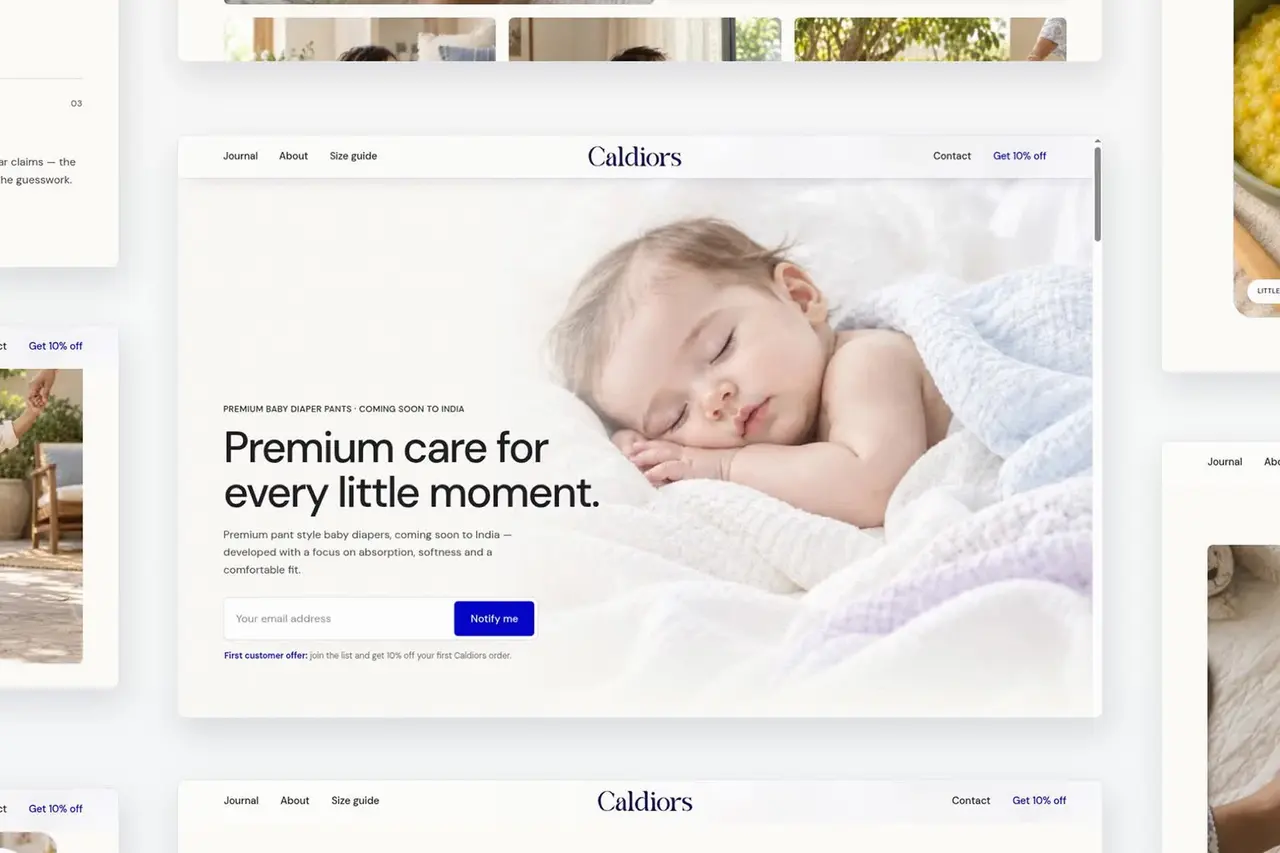 Case study
Caldiors: website for a premium baby-care brand
Clean design, thoughtful details and a pre-launch waitlist for a premium baby diaper brand, built with Next.js and React.
Read the case study →
Pricing
Quoted per project
Priced by the number of screens, charts and data sources. Hourly work is $55 for Next.js and React and $58 for backend APIs.
Working with me remotely
I work from Surat, India, on India Standard Time (UTC+5:30). I work with clients anywhere in the world. My day overlaps with the European working day, and calls with clients in the USA are arranged for the US morning. I studied for my master's degree and worked as a software developer in the United States. All communication is in English, with written updates so you always know where the project stands.
Questions clients ask
What makes a good dashboard?
A good dashboard answers the user's main questions at a glance. The most important numbers come first, each chart has one job, and details are a click away instead of crowding the first screen.
Do you design it, build it, or both?
Both. I can design the dashboard in Figma, build one from your existing design, or do the whole job.
Can you connect it to our existing data?
Yes. I connect to your API or database, or build the API if there is none yet.
Will it work on a phone?
Yes. Tables and charts are laid out differently on small screens so they stay readable.
Can you fix a slow dashboard?
Yes. Slow dashboards are usually caused by heavy queries or loading too much at once. I find the cause first, then fix the queries, add caching or change how the page loads data.
Do you use a template or build from scratch?
Whichever fits. A component library speeds up standard tables and forms, and the parts that make your product different are designed and built for it.
Other services
-
Service
SaaS and CRM development
SaaS products and custom CRM systems designed and built: accounts, roles, billing and integrations.
See what is included → -
Service
UI/UX design
User flows, wireframes, interface design and clickable Figma prototypes for web and SaaS products.
See what is included → -
Service
Front end development
Fast, responsive React and Next.js websites and interfaces, from Figma design to launch.
See what is included →